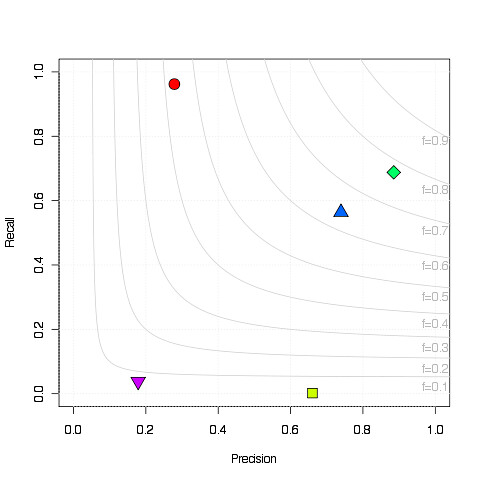
Plotting Precision and Recall values
While helping Benjamin write our recent ISWC paper we were drawn between plotting recall, precision or the f1-measure (a non-linear combination of the two). In theory f1-measure is the best since it leaves you with less numbers to display, but we focussed especially on recall, so we wanted this. In the end we plotting each approach we compared against both recall and precision in a 2d plot. We briefly thought about showing f-measure in the same chart, but the deadline came and there was no time left.
No the deadline is gone, but I made it work in R:
The fun thing about this is that both me and Ben tried to “solve” the f-measure equation for either R or P, i.e from:
![]()
get to:
![]()
And it took me at least three attempts to get it right. I am glad I’ve not forgotten any of my school math… ahem.
Get the R code at: http://www.dfki.uni-kl.de/~grimnes/2009/06/fmeasure/fmeasurePlot.R
